English version of this content is provided by automatic translation without the assistance of a human translator. See the Japanese version of this content for accurate and up-to-date information.
Target plan 
In the timeline, you can check the transition of the score of automatic diagnosis in chronological order.
Here, we will introduce the procedure for checking the timeline.
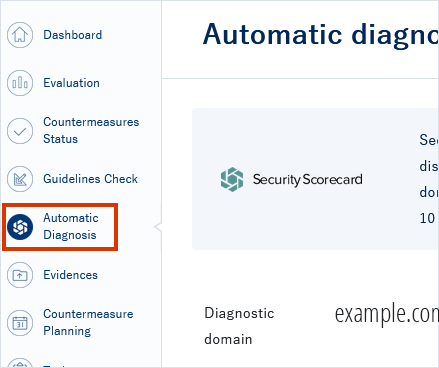
1. Click [Auto Diagnosis] from the menu on the left side of the screen.
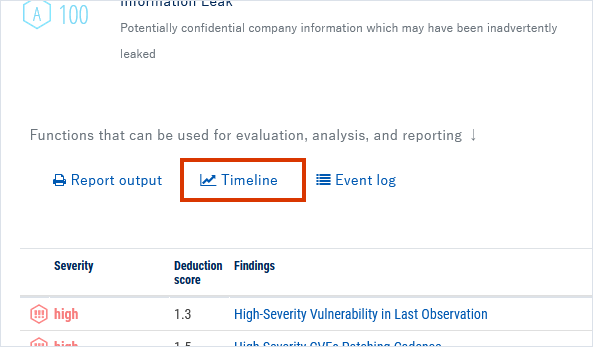
2. Functions that can be used for evaluation/analysis/report> Click [Timeline]
Since the automatic diagnosis result is displayed, click [Timeline] from the functions that can be utilized for evaluation, analysis, and reporting in the middle of the screen.
3. Check the timeline
The timeline for automatic diagnosis is displayed.
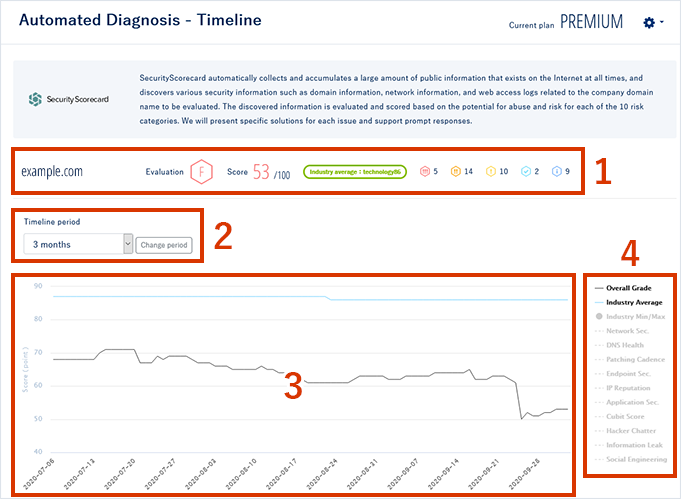
- Overall results are always displayed at the top of the page.
- You can change the display period of the timeline.
The period can be selected from 3 months/6 months/12 months/18 months/24 months. Select the period from the pull-down and click [Change period]. - The fluctuation of the score is displayed as a timeline. The horizontal axis represents time and the vertical axis represents score.
- In addition to the overall score and the same industry average, you can display the score for each evaluation category.
Click the category you want to display and the timeline will be displayed.
For the category of automatic diagnosis, see About automatic diagnosis.