English version of this content is provided by automatic translation without the assistance of a human translator. See the Japanese version of this content for accurate and up-to-date information.
Target plan 


The result of evaluating the security countermeasure status is displayed quantitatively.
You can also grasp your own "position" compared to other companies from deviation values and averages of other companies.
Since it is categorized into four categories: strategy, organization, technology, and emergency response, you can immediately check the security measures that need to be strengthened.
Comprehensive Evaluation | Strategy/Organization/Technology/Emergency Response
Comprehensive evaluation
The evaluation results are displayed quantitatively.
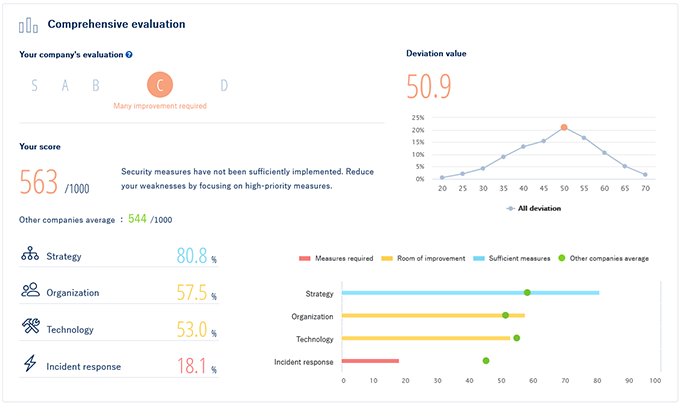
Your company's evaluation
It is displayed in 5 grades from S to D.
Evaluation is determined by the score. The scores corresponding to each evaluation are shown in parentheses.
S : Very high level (800-1000)
A : High level (700-799)
B : There is room for sophistication (600-699)
C : Weak point reinforcement required (500-599)
D : Basic measures required (0 to 499)
Your score
The score out of 1000 is displayed.
Deviation value
Shows your position in the whole as a deviation value.
The position of ● on the graph is displayed in increments of 5 (50, 55, 60) and represents the range of values from -2.5 to +2.4.
【Concrete example】
47.5-52.4 → 50
52.5-57.4 → 55
57.5-62.4 → 60
Strategy/Organization/Technology/Emergency response
We classify into four categories and display each correspondence degree with percentage and color.
Red : measures required
Yellow : Consideration for improvement
Blue : Enhanced measures
Other companies average
Shows the scores of all companies using Secure Sket CH and the average implementation rate by category.
TIPS
You can narrow down the attributes of companies to compare from [Comparison target in evaluation] at the top of the page.

For details on how to use it, see Narrowing down the companies for comparison.
※Not available with FREE plan. An application for the PREMIUM plan is required.
Strategy/Organization/Technology/Emergency response
It is classified into 4 categories and the details of each are displayed.
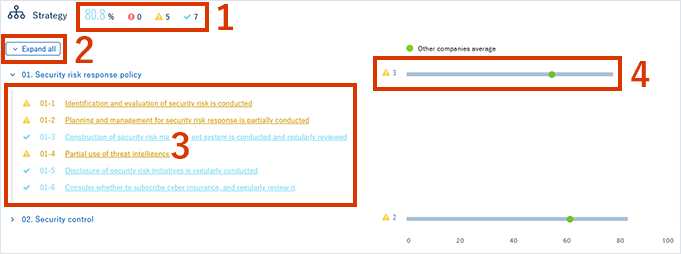
- Percentage represents the response status ratio.
 measures are the number of items that measures
 The number of items of improve study
 of measures shows the number of items of measures satisfaction.
 - Click Expand All to see all questions in that category.
- Click the question to see the detail page of the question.
- The correspondence status is displayed in a graph.
The gray bar graph shows the implementation rate of your company, and the green ● shows the average value of other companies.
If you move the cursor to the bar graph and ●, you can check the specific values.