English version of this content is provided by automatic translation without the assistance of a human translator. See the Japanese version of this content for accurate and up-to-date information.
Target plan 
A comprehensive evaluation of the entire group for the answers to security countermeasure questions is displayed, allowing you to grasp the current status of the entire group.
In addition to the score and rank of the entire group, you can check the evaluation for each diagnosis.
TIPS
In the group function, the term "diagnosis" is used to refer to each company or branch that is the target of evaluation. Example: diagnosis name, number of diagnoses, etc.
Group comprehensive evaluation | Evaluation list for each diagnosis
Group overall evaluation
The group-wide evaluation of the answers to the security countermeasure questions is displayed.
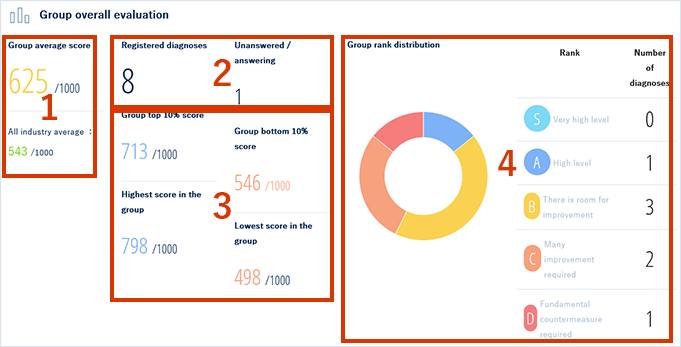
- Shows the average score for each diagnosis in the group.
As a reference value, the average score of all statistical data of the service is also displayed. - Number of registered diagnoses : Number of diagnoses registered in the group
Unanswered / Answering : Number of diagnoses for which the answer to the question is not completed - Shows each score in the group.
- The distribution of ranks within the group is displayed as a graph and a list.
The rank is displayed on a scale of 5 from S to D, and is determined by the score.
The scores corresponding to each rank are as in ().
S : Very high level (800-1000)
A : High level (700-799)
B : There is room for sophistication (600-699)
C : Weak point reinforcement required (500-599)
D : Measure implementation required (0 to 499)
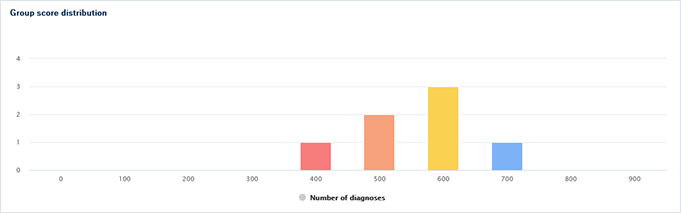
The score distribution within the group is displayed in a graph. The horizontal axis shows the score and the vertical axis shows the number of diagnoses.
Move the cursor to the graph to check the specific number of diagnoses.
The evaluation is classified into four categories: strategy, organization, technology, and emergency response, and the average score for each category of each diagnosis belonging to the group is displayed.
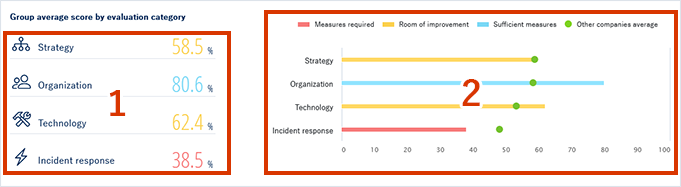
- Displays the average score for each diagnostic category in each evaluation category in percentage and color.
Red : measures required
Yellow : Consideration for improvement
Blue : Enhanced measures - The contents of 1 are displayed in a graph, and the average value of all the statistical data of other companies is represented by the green ●.
Move the cursor to the graph and ● to check the specific value.
Evaluation list for each diagnosis
A list of evaluations for each diagnosis is displayed.
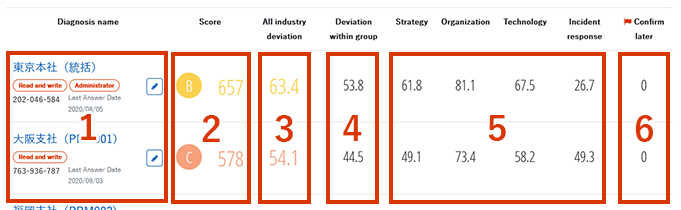
- The diagnosis name, authority, diagnosis ID, and last answer date are displayed.
Click the diagnosis name to display the dashboard screen for that diagnosis name. Click to edit the display name of each diagnosis.
 - The rank and score for each diagnosis are displayed.
- The national deviation value displays the position of each diagnosis in the overall statistical data of the service as a deviation value.
- The deviation value within a group displays the position of each diagnosis within the group as a deviation value.
- The score for each of the four categories (strategy/organization/technology/emergency response) is displayed as a percentage.
- The number of questions for which “Check later” is checked when responding is displayed.
See Answering the Secure SketCH Questions for more information on confirmation later.