Target plan 
English version of this content is provided by automatic translation without the assistance of a human translator. See the Japanese version of this content for accurate and up-to-date information.
The overall rating for the entire group of guideline checks is displayed.
In addition to the overall group score and rank, you can also see the ratings for each diagnosis.
TIPS
・In the group function, the word “diagnosis” is used when referring to each company or branch that is being evaluated. Example: diagnosis name, number of diagnoses, etc.
・The target of the group guideline check score calculation is the diagnosis while using the GROUPS (PLUS) plan or GROUPS (PREMIUM) plan.
Group comprehensive evaluation | Evaluation list for each diagnosis
Group comprehensive evaluation
The guideline check rating for the entire group is displayed.
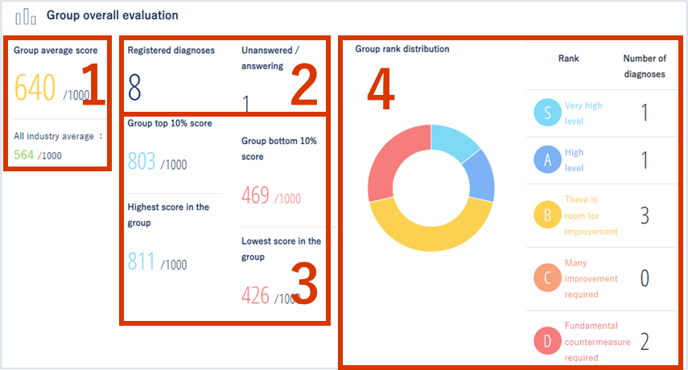
- The average of the scores for each guideline in the group is displayed.
The average of other companies nationwide is also displayed. - Number of registered diagnoses: Number of diagnoses registered in the group
Unanswered/Responding: Number of diagnoses for which the guideline check has not been activated or the response has not been completed - Display each score within a group.
- The distribution of each diagnostic rank (S to D) is displayed.
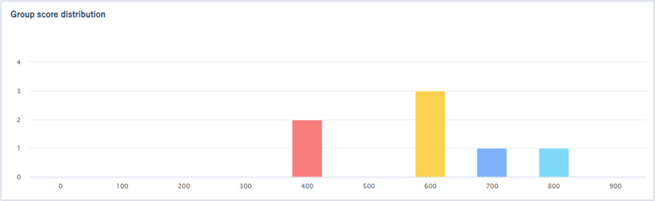
The group score distribution is displayed graphically. The horizontal axis represents the score, and the vertical axis represents the number of diagnoses.
Hover over the graph to see the specific number of diagnoses.
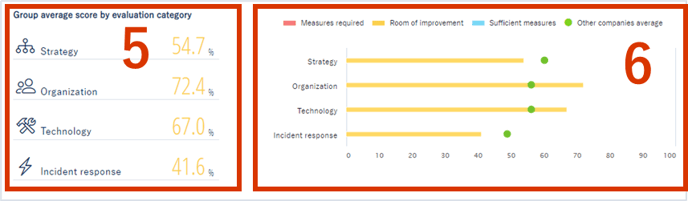
5. Shows the average score by rating category within a group
6. Displays the implementation rate of the nationwide average of other companies and the diagnosis group average by evaluation category
Evaluation list for each diagnosis
A list of ratings for each diagnosis is displayed.
Category display
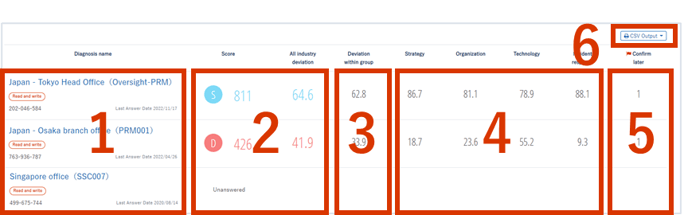
- The diagnosis name, authority, diagnosis ID, and last aggregation date are displayed.
Click a diagnosis name to display the guideline results screen for that diagnosis name.
[Last Response Date] is the date you last responded to the guidelines.
If [Automatic calculation] is displayed, the evaluation result will be automatically calculated from the answers to the Secure SketCH standard questions. - The rank, score, and national deviation for each diagnosis are displayed.
If the guideline check is not enabled or the answer is incomplete, [Service invalid] is displayed. - The within-group deviation value for each diagnosis is displayed.
- The implementation rate for each guideline category is displayed. The categories displayed depend on the guidelines.
- The number of items with [Confirm later] checked is displayed.
- By clicking [CSV output], you can download the [Responses] and [Evaluation results] as CSV data.
[Answer] CSV data includes the following items.
・Diagnosis ID
・Diagnosis name
・Last answer date
・Responses to guidelines
[Evaluation results] CSV data includes the following items.
・Diagnosis ID
・Diagnosis name
・Last answer date
・Rank
・Total score
・Scores for each category
The group comprehensive evaluation, the evaluation list for each diagnosis, and the CSV output evaluation results display the daily aggregated results.
You can download the latest answers in CSV output answer download. However, if you answer Secure SketCH for the first time, you can download the answer after the daily tally.