English version of this content is provided by automatic translation without the assistance of a human translator. See the Japanese version of this content for accurate and up-to-date information.
Target plan 
A comprehensive assessment of automatic diagnostics for the entire group is displayed.
In addition to the score and rank of the entire group, you can check the evaluation for each diagnosis.
TIPS
In the group function, the term "diagnosis" is used to refer to each company or branch that is the target of evaluation. Example: diagnosis name, number of diagnoses, etc.
Group comprehensive evaluation | Evaluation list for each diagnosis
Group overall evaluation
The assessment of the automatic diagnosis for the entire group is displayed.
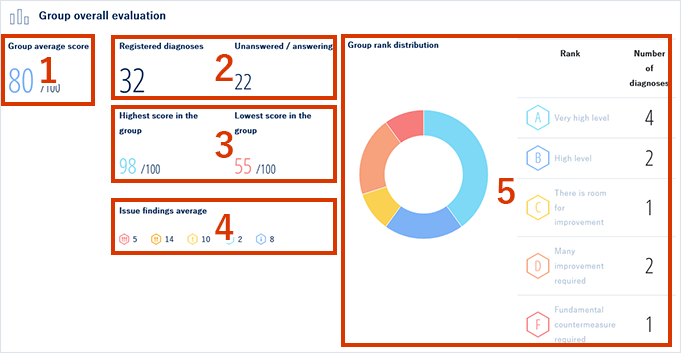
- Shows the average of the automatic diagnostic scores for each diagnosis in the group.
- Number of registered diagnoses : Number of diagnoses registered in the group
Unanswered/Unanswered : The number of diagnoses for which the automatic diagnosis function is not enabled or the score is being calculated - Shows each score in the group.
- The icon represents the severity, and the number represents the within-group average of the number of detected issues that correspond to that severity.
 high
high middle
 low
low Positive
 Reference
 - The distribution of ranks within the group is displayed in a graph and table.
Ranks are evaluated on a scale of 5 from A to D/F.
A : Very high level
B : High level
C : There is room for sophistication
D : Weak point reinforcement required
F : Measure implementation required
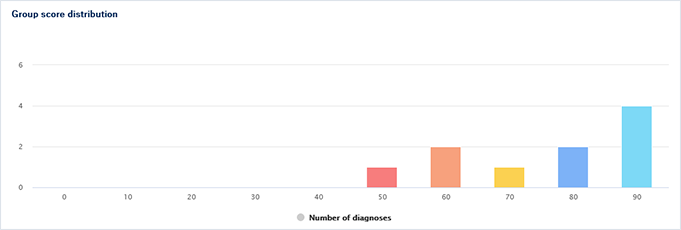
The score distribution of the group is displayed in a graph. The horizontal axis shows the score and the vertical axis shows the number of diagnoses.
Move the cursor to the graph to check the specific number of diagnoses.
Displays group average scores by 10 rating categories.
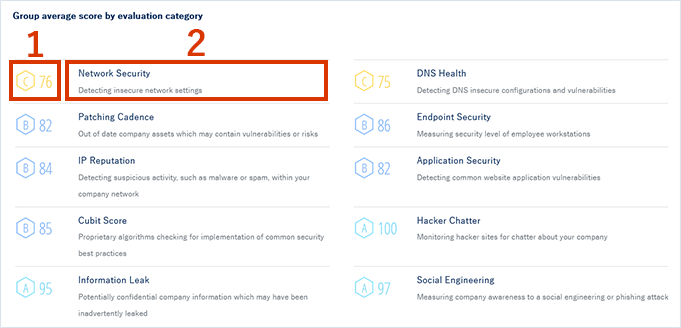
- Displays the average rank and score for each evaluation category of each diagnosis belonging to the group.
- The name of each category and a description of the category are displayed.
Evaluation list for each diagnosis
A list of evaluations for each diagnosis is displayed.
You can switch the display by category/issue.
Category display
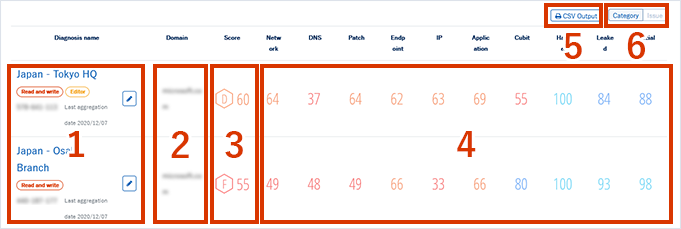
- The diagnosis name, authority, diagnosis ID, and last aggregation date are displayed.
Click the diagnosis name to display the automatic diagnosis result screen for that diagnosis name. Click to edit the display name of each diagnosis.
 - The domain name to be evaluated by the automatic diagnosis is displayed.
- The rank and score for each diagnosis are displayed.
- The scores for each of the 10 rating categories are displayed.
- You can download the list as CSV data by clicking [CSV output].
The CSV data includes the following items.
- Diagnostic ID
- Diagnosis name
- Last aggregation date
- Domain
- Rank
- Score
- Network Security_Rank
- Network Security_Score
- Rank for each of the 10 rating categories
- Score for each of the 10 rating categories
- Number of applicable items for each severity - You can switch the display between categories and issues by clicking [Category/Issue]. The screen above is the display when a category is selected. Please check the following for the display screen when you select an assignment.
Issue display
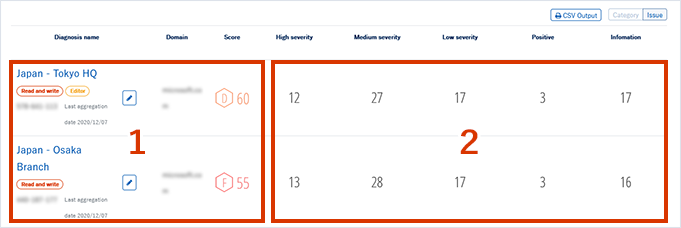
- The same contents as the category display are displayed.
- Displays the number of detected issues by severity (high/medium/low/positive/reference).